Home
Alumni Stories
Charger Respect Pledge
Hired Before Graduation
News Releases
In The News
Spotlights
Home
Alumni Stories
Charger Respect Pledge
Hired Before Graduation
News Releases
In The News
Spotlights
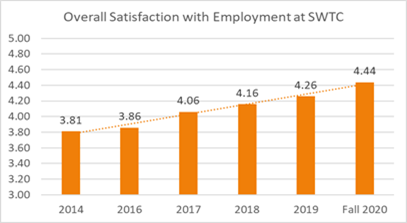
employment-satisfaction-chart
‹ Return to
employment-satisfaction-chart
Posted on
October 26, 2020
by
Mike Steffel
Posted in
Image Information
Full Size:
407×223
px